
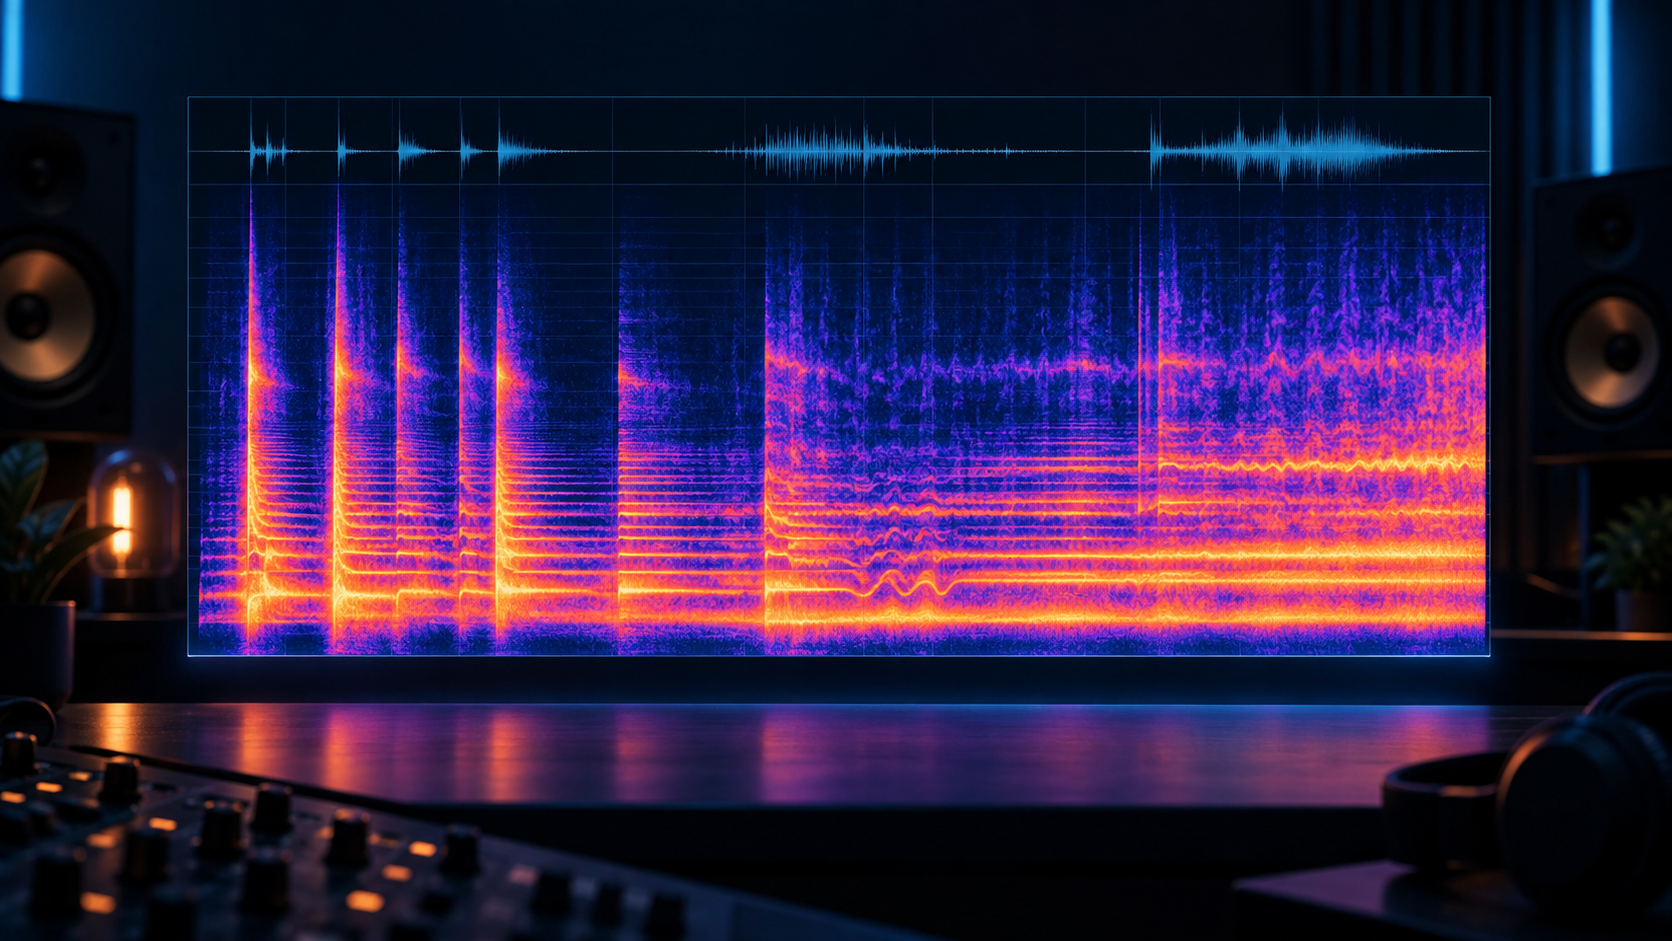
Audio heatmap in one sentence
An audio heatmap, often called a spectrogram, maps how frequency energy changes over time. The horizontal axis tells you when something happens, the vertical axis tells you which frequency range is involved, and color tells you how much energy is present there.
This is the key difference from an average spectrum. A spectrum answers: “what is the overall tonal balance?”. A heatmap adds: “when does that balance change?”. It can show whether a problem appears only when the chorus arrives, lasts across the whole master, or returns rhythmically with every kick.
How to read three kinds of information at once
Think of a heatmap as a weather map for sound. The useful information is not one color, but the shape of the energy, its duration and whether it appears where the musical structure suggests it should.
- Time, horizontally: The left side is the beginning and the right side is the end. Gaps, verses, choruses, drops and transitions create recognizable blocks.
- Frequency, vertically: The bottom shows sub and bass, the lower middle shows low-mids and presence, and the top shows high frequencies. A logarithmic scale is usually closer to how we hear music.
- Color: Dark areas contain less energy and brighter areas more. Bright points are clues, not automatically errors: a kick and snare should have visible energy.
Do not compare two images only by asking which one is more colorful. The color scale may be relative, stretching from the quietest to the loudest part of each file. For Before/After comparisons, use the same settings, palette and dynamic range.
Heatmap patterns worth learning
The real value comes from recognizing recurring shapes. These patterns are not fixed diagnoses, but they are excellent starting points.
- Horizontal lines: Sustained notes, bass tones, room resonances or long harmonic tails. If one thin line stays much brighter than its neighbors, check it as a possible resonance.
- Bright vertical bands: Transients — kick, snare, clap, bass attack or a sudden chord. A band stretching upward usually means a broadband event.
- A dense bright cloud in the low end: Strong sub and low-mid energy. It may be the intended weight of the genre, or it may consume headroom and drive the limiter.
- A bright rectangle in the middle: A sustained pad, guitar, vocal midrange or arrangement density. Listen for whether the center stays separated when more layers arrive.
- Thin sharp lines at the top: Sibilance, hi-hats, clicks, noise or digital artifacts. Do not remove the top automatically; check whether it is musical and tiring.
- Regular grids or repeated spikes: Rhythmic transients, but sometimes a processing artifact. If the pattern does not match the rhythm and sounds metallic, compare the export before and after encoding.
How a heatmap helps find a real problem
First decide whether the pattern is constant, momentary or repeating. That immediately narrows the likely fix.
- Momentary problem: One spike on a word, snare or transition usually needs automation, clip gain, de-essing or transient control rather than a broad master EQ cut.
- Repeating problem: If a bright area returns with every kick, bass or snare, check timing, sidechain, phase and masking.
- Mud: A wide, constantly bright low-mid cloud can mean several sources are overlapping. Find the source in the mix instead of cutting the whole range from the master.
- Harsh top end: Energy around 3-8 kHz can add attack and clarity, but a continuously bright dense arrangement can become tiring. Compare with a reference at matched loudness.
- Noise and silence: A steady high-frequency layer in gaps may be noise floor, reverb, tape, room tone or a plugin. Listen to the gap before denoising.
- Clipping: Very bright short vertical spikes may accompany clipped transients, but a heatmap does not replace True Peak measurement or lossy-encoding listening.
A practical workflow: from map to DAW decision
- Listen without looking: Note the first impression — heavy low end, sibilance, sharp snare or a disappearing vocal. The heatmap should test a question, not replace listening.
- Mark the moment: Note the minute and second. Is it the verse, chorus, transition or one isolated hit?
- Find the range: Look from bottom to top. Is the energy in the sub, low-mids, presence or high end? Do not start with a random broad cut.
- Connect it to arrangement: Identify which instruments are active at that moment. If you do not have stems, use mute and solo in the DAW to test the hypothesis.
- Make the smallest effective change: Start with automation, clip gain, gentle dynamic EQ or a short sidechain. Reserve large master moves for problems that truly affect the whole mix.
- Compare at matched loudness: A brighter or louder version often sounds better. Recheck LUFS, True Peak and dynamics after the change.
- Check the map again: A good fix does not need to make the heatmap empty. It should reduce the unwanted pattern without removing energy, transients or character.
What a heatmap cannot tell you
A heatmap is powerful, but it does not know artistic context. It cannot decide whether strong sub is a mistake or the foundation of a genre. It cannot reliably separate bass from kick, vocal from guitar, or intentional distortion from a fault.
- It is not stem separation: One master image does not identify which track creates the energy.
- It is not a phase meter: It mainly shows time-frequency energy. Use correlation, mono and listening for channel relationships.
- Resolution is a trade-off: A short window gives better timing but poorer frequency resolution. A long window separates tones better but smears transients.
- Color depends on scale: The palette can hide quiet detail or exaggerate differences. Compare files using identical settings.
- The picture does not replace musical judgment: If something looks intense but sounds right and translates across systems, do not fix it just to make the image prettier.
Heatmap in Aumixys: how to use it well
In Aumixys, the Heatmap tab shows time-varying energy as one part of a wider report. Read it with Waveform, Spectrum, LUFS, True Peak, Stereo and QC. Each view answers a different question:
- Heatmap: When and in which frequency range does energy appear?
- Waveform: What do the envelope, short-term level and transients look like?
- Spectrum: What is the average frequency balance?
- LUFS and dynamics: How dense and loud is the track overall?
- True Peak and QC: Do peaks, clipping or headroom need attention?
When you see a bright band, do not ask only “what should I cut?”. Ask: what is playing here, is the energy needed, does it interfere, and does the problem survive normalization? That leads to better decisions than hunting for a pretty picture.
Frequently Asked Questions (FAQ)
Is a heatmap the same as a spectrogram?
In practice they often describe the same kind of visualization: time runs horizontally, frequency vertically, and color represents energy. "Heatmap" emphasizes color coding, while "spectrogram" describes the time-frequency analysis.
Does a brighter color always mean a problem?
No. A brighter color means more energy in that region, but music needs energy. It becomes a problem when the area is disproportionate, lasts too long, repeats as a resonance, or matches an unpleasant listening result.
What do bright vertical bands mean?
They are usually transients: kick, snare, clap, bass attack or a sudden chord. If a band stretches from low to high frequencies, the event is broadband. One vertical band is usually normal; a series of sharp bands may point to hard, aggressive transients.
Can a heatmap tell me which instrument causes the problem?
A heatmap shows energy behavior, not track names. You can connect a pattern to an instrument by matching it with listening, arrangement and song position. Precise source identification requires soloing, stems or working in the DAW session.
Why does a heatmap look different with different settings?
The result depends on FFT window length, frequency resolution, color scale, dynamic range and smoothing. A short window shows timing and transients better; a long window separates nearby frequencies better. Compare heatmaps using the same settings.
Can I fix a mix using only the heatmap?
No. A heatmap is a map for asking better questions, not an automatic verdict. Confirm every decision by listening, comparing a reference and checking after the change, ideally at matched loudness.
Check it on your track
See where energy, resonance, mud and harshness appear over time instead of guessing from listening alone.